Understanding recruitment outreach metrics is now essential for leaders who want predictable appointment flow and evidence-led decision-making.
Executive Summary
Recruitment outreach metrics have become a critical operating system for firms that want predictable, stable appointment flow in volatile hiring markets.. Across the global recruitment sector, firms that consistently hit revenue targets shift from intuition-led outreach to data-driven appointment systems. This report focused on Recruitment Metrics for Predictable Appointment Booking shows how three core metrics (acceptance, replies, conversion) and a compact process for monitoring them turn outreach from noisy activity into a predictable business capability.
- Declining response rates across generic outreach channels,
- Rising automation risks that can reduce platform reach,
- Platform-level trust constraints (notably on LinkedIn) that penalize unsafe patterns, and
- Higher expectations from founders and hiring leaders for forecastable deal-flow.
Most agencies still lack the foundational visibility to scale conversations, influence decision-making, or stabilize revenue without increasing costs. A simple example: stabilizing a hiring team’s acceptance rate from 12% to 30% can reduce outreach volume by more than half while yielding the same number of qualified conversations cutting time and expense and improving quality.
Phil Pelucha’s Appointment Booking AI™ reframes outreach as an integrated conversion ecosystem. In that ecosystem, acceptance rates, replies, and conversion dashboards function as operational metrics that reveal market resonance, conversion efficiency, and pipeline velocity data points a company board can use to set priorities and measure success.
This report provides a concise strategy and practical process for leaders to:
- Understand the market forces that make precise metrics essential
- Adopt the strategic KPIs that reliably predict revenue outcomes
- Interpret those KPIs with consulting-grade rigor so teams can act fast
- Implement transformation pathways that stabilize appointment flow in 30–90 days
This is not a marketing piece. It is a practical, board-level operating model that links metrics to resource allocation, team priorities, and the company’s hiring and business outcomes so leaders can make fewer guesses and more decisions.
In a volatile hiring landscape, recruitment outreach metrics provide the operational visibility teams need to scale conversations without increasing cost.
Market Context: Why Metrics Now Matter More Than Ever
Recruitment has entered a new equilibrium driven by tighter budgets, platform constraints, and higher stake hiring decisions. To manage risk and scale sustainably, companies must treat outreach as a repeatable process instrumented by reliable metrics.
1) Buyers have become hyper-selective.
Founders, CEOs, and hiring leaders no longer respond to generic, one-size-fits-all messaging. They expect partners who understand segment-specific problems, runway pressures, hiring velocity, and acceptable risk so recruitment teams must shorten the time between first contact and perceived relevance.
2) LinkedIn has hardened its trust and safety algorithms.
LinkedIn and other social media channels are increasingly sensitive to high-volume or repetitive automation patterns. Signals such as low-quality accepts or mass messaging now increase the likelihood of throttled reach or penalties. Recruiters with poor outreach hygiene can face:
- Throttled reach,
- Limited visibility,
- Shadow restrictions, and
- Permanent account degradation.
Source note: platform guidance and several industry surveys in 2023–24 report increased enforcement and reduced organic reach for unsafe automation patterns; teams should monitor trust signals as a core operational metric.
3) Talent markets operate in micro-segments.
Tactical one-message-fits-all outreach breaks down across technical segments. AI/ML, cybersecurity, fintech, and deep tech each require tailored language, evidence, and pain framing. Market resonance must be measured at the segment level, not assumed from aggregate campaign performance.
Practical example: a message that performs well in fintech (emphasizing regulatory hiring velocity) can underperform in deep tech (where “research pedigree” and product signal matter). Tracking per-segment metrics reduces wasted outreach and improves conversion efficiency.
4) Owners demand predictable deal-flow.
Boards and executives are moving away from feast-or-famine hiring cycles. They require forecastable revenue, stable appointment flow, and consistent opportunity quality so that hiring and go-to-market departments can plan resources without expensive last-minute pivots.
- Forecastable revenue,
- Stable appointment flow,
- Consistent quality of opportunities.
In practice, this means instrumenting the outreach process with day-by-day metrics so owners can forecast booked calls and allocate recruiting resources proactively rather than reactively reducing cost per attempt and improving hiring predictability.
Conclusion:
The firms winning today treat outreach as a scalable system, not a salesperson’s daily habit. Metrics measured at the right cadence and by the right process are no longer optional; they are the operating structure that aligns team effort, reduces wasted time, and improves hiring performance.
The Strategic KPI Architecture for Modern Recruitment Firms
Phil’s methodology centers on three primary, board-grade KPIs that together predict appointment flow and revenue impact. These metrics should be tracked as part of a repeatable process and calculated from raw outreach data so leaders can make fast, evidence-based decisions.
- Acceptance Rate – Market Access Indicator
- Reply Rate – Engagement & Authority Indicator
- Conversion-to-Call Rate – Commercial Impact Indicator
Quick definitions (use these formulas in your dashboards):
- Acceptance Rate = connections accepted ÷ invites sent (measures market permission).
- Reply Rate = replies received ÷ connections accepted (measures engagement quality and authority delivery).
- Conversion-to-Call Rate = calls booked ÷ replies received (measures commercial effectiveness).
- Supporting metrics you must track: Positive vs Negative Response Ratio, Authority Cue Response Rate, LinkedIn Trust Score Signals, Conversation Quality Index, Pipeline Velocity, Market Resonance Score, and Iteration Loop Efficiency.
These metrics are the vital signs of your outbound engine: when they’re stable and trending in the right direction, teams can increase volume safely; when they falter, the process and messaging need immediate attention. The next sections unpack each KPI, show examples, and provide operational strategies to improve the scores and overall efficiency.
KPI #1 – Acceptance Rate
The Leading Indicator of Market Permission
Acceptance Rate answers one operational question: who is granting you permission to engage? As the earliest approval signal, it tells you whether your outreach process, profile, and positioning grant market access or whether you’re being filtered out before a conversation can begin. Among all recruitment outreach metrics, acceptance rate is the earliest signal of market permission and segment alignment.
“Does the market want you in the room?”
A high acceptance rate typically signals several positive conditions:
- Your invite resonates with the target audience,
- Your positioning aligns with target expectations,
- Your profile and social proof support credibility, and
- Your automation and outreach cadence mimic human behaviour and avoid trust penalties.
Standard calculation to use in dashboards: Acceptance Rate = (connections accepted ÷ invites sent) × 100. Track this number daily and by segment so you spot changes in time and by process.
Phil’s live data example (tracked over a 30‑day period) shows:
- 373 invitations sent
- 124 accepted
- 33.2% acceptance rate
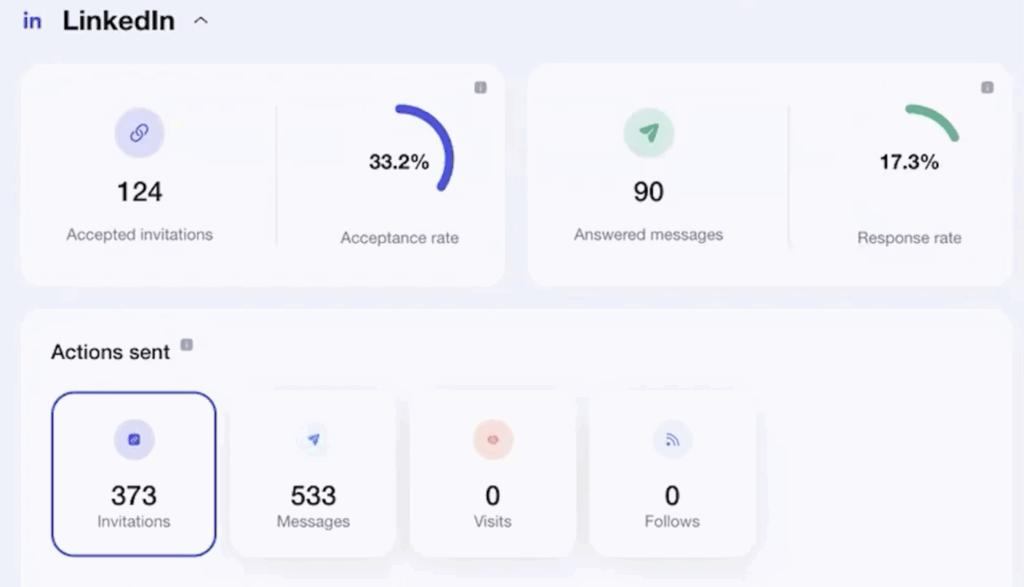
Context: a 33.2% acceptance rate places this example in the upper tiers of performance and depending on segment exceeds common B2B baselines. (When applying these benchmarks, always note sample size and period: short bursts can overstate long-run performance.)
Strategic Interpretation (Consulting-Level)
What a high Acceptance Rate usually indicates:
- Strong Market Alignment – messaging matches the segment’s priorities and pain language
- High Trust Profile – LinkedIn and prospects treat your account as credible and safe
- Effective Segmentation – target lists are precise and relevant
- Recognized Authority Baseline – prospects perceive immediate value from connecting
Conversely, a low Acceptance Rate commonly signals problems that demand process fixes:
- Mismatched targeting (wrong titles, functions, or segments),
- Weak profile positioning or missing social proof,
- Irrelevant or overly generic invites that fail to communicate value,
- Unsafe automation patterns (high volume, identical messaging),
- Brand narrative misalignment where the firm’s stated focus does not match outreach claims.
| TIER | ACCEPTANCE | RATE INTERPRETATION |
|---|---|---|
| Underperforming | <10% | Market rejection or unsafe practices |
| Developing | 10-20% | Early alignment but weak resonance |
| Competitive | 20-30% | Industry-standard performance |
| High-Performing | 30-40% | Strong authority & relevance |
| Elite | 40% | Exceptional positioning & segmentation |
Practical guidance:
If your Acceptance Rate is under 20%, pause any volume increases. Focus first on profile optimization, invite messaging experiments (A/B at the message level), and tighter segmentation. These process changes typically produce the largest improvements in number of accepts per invite and reduce wasted time and costs per qualified conversation.Recruiters in the elite tier dominate deal-flow with minimal volume because they optimise for quality of invites, not raw outreach quantity.
KPI #2 – Reply Rate
The Measure of Dialogue, Not Noise
Acceptance opens the door; replies start the conversation. Reply Rate measures whether your positioning and messaging convert passive accepts into active engagement and it is the clearest metric of authority delivery and message effectiveness.
Standard formula for dashboards: Reply Rate = (replies received ÷ connections accepted) × 100. Track this by segment and day-by-day so you can identify timing, channel, and message-level effects on performance.
Phil’s dashboard example (30‑day window) shows:
- 90 answered messages
- 17.3% reply rate strong performance for high-seniority markets where replies are harder to earn
What Reply Rate Means Strategically
Reply Rate is a diagnostic metric for four operational levers:
- Authority Delivery – Does the intro establish credibility quickly?
- Market Fluency – Are you speaking the segment’s language and pain points?
- CTA Precision – Is your next step low-friction and clearly valuable?
- Tone Quality – Does the message read as a peer/partner rather than a vendor?
Low Reply Rate usually indicates one or more breakdowns in the outreach process: unclear value, misaligned tone, over-selling, weak authority narrative, irrelevant lead-ins, or poor timing (sending during low-engagement periods). High Reply Rate signals that your team is delivering relevant, timely value that prompts prospects to engage.
Quick, High-Impact Experiments
- Micro-test 1: Replace a generic CTA with a low-friction question (e.g., “Are you hiring for X this quarter?”) and measure reply lift over 500 accepts.
- Micro-test 2: Swap a one-line credibility cue (customer name or metric) into the first sentence and compare reply rates by segment over two weeks.
- Micro-test 3: Change send times to target peak engagement windows for your segment and measure replies per day to optimise timing.
| TIER | ACCEPTANCE | RATE INTERPRETATION |
|---|---|---|
| Underperforming | <5% | Market disengaged, authority narrative broken |
| Developing | 5-10% | Early credibility forming |
| Competitive | 10-15% | Functional communication |
| High-Performing | 15-25% | Strong engagement |
| Elite | 25%+ | Deep authority and high relevance |
Operational guidance:
If your Reply Rate is below 10%, prioritise message and CTA experiments before scaling volume. Higher acceptance without replies indicates a missed opportunity to convert connects into conversations so cross-reference Acceptance Rate and Reply Rate daily to manage the end-to-end process and maximise the number of qualified responses per time and per process.Recruiters in the elite tier are treated as trusted advisors, not vendors, because their messaging routinely converts connection into meaningful dialogue.
This KPI sits at the center of recruitment outreach metrics because replies represent true engagement, not superficial activity.
KPI #3 – Conversion-To-Call Rate
The Revenue KPI
This is the metric company owners care most about because it directly links outreach activity to booked, revenue‑generating conversations. Conversion-to-Call Rate measures how effectively your process turns engaged prospects into scheduled calls that your hiring and commercial teams can act on.
Dashboard formula (use this in your pipeline reports): Conversion-to-Call Rate = (calls booked ÷ replies received) × 100. Track this metric by segment and by sequence so you can attribute conversion lifts to message changes, responder handling, or timing adjustments.
Conversion-to-Call Rate shows you several things at once:
- How many conversations progress to booked meetings (the direct acquisition velocity),
- Whether your sequences and CTAs drive commercial outcomes rather than just surface engagement,
- Whether your positioning and qualification justify the ask for a call, and
- How well your team handles inbound replies and moves prospects toward a confirmed time slot.
Strategic priority: this metric converts outreach work into tangible pipeline value. Improving Conversion-to-Call Rate reduces the number of replies and accepts you need to generate a target number of booked calls lowering cost per attempt and increasing efficiency.
Top operational levers to increase Conversion-to-Call Rate:
- CTA alignment: make the call ask tightly aligned with the prospect’s perceived problem (replace broad asks with outcome-focused CTAs).
- Call framing: pre-frame the meeting by clarifying agenda, expected duration, and the commercial question you’ll solve reduce perceived risk and time cost.
- Follow-up cadence: implement a structured follow-up sequence with 24–72 hour response SLAs and clear ownership so inbound replies are captured and converted quickly.
Strategic Interpretation
Low conversion-to-call rate typically reflects (in order of priority): poor CTA alignment, weak call framing, inconsistent follow-up, unclear value narrative, mishandled inbound replies, or slow response velocity. Each of these is a process issue you can test and fix in 7–30 days.
High conversion signals indicate commercial clarity, strong brand narrative, a controlled pipeline, consistent positioning, and disciplined follow-ups qualities that separate companies that scale predictable hiring from those that remain reactive.
Example sequence that improves conversion
(Short template to test)
- Reply handler: acknowledge + one-sentence credibility cue (e.g., “Thanks we helped Company X hire a senior engineer in 6 weeks”).
- Framing line: state agenda and time commitment (e.g., “If you’re open, a 20‑minute call to align on hiring velocity and candidate fit”).
- Low-friction CTA: propose two specific times or offer a calendar link and ask which is preferred.
Measure results by running A/B tests across 200–500 replies per variation and comparing Conversion-to-Call Rate and average time-to-book as primary performance metrics.
Operationally, link this KPI to your LinkedIn Conversion Dashboard so owners can forecast booked calls over 7, 14, and 30 days and allocate recruiting resources accordingly. When conversion improves, hiring costs fall and the business can predictably scale outreach without adding proportional headcount or resources.
The LinkedIn Conversion Dashboard A Recruitment Firm’s Command Center
Phil’s live demonstration presents a compact LinkedIn Conversion Dashboard designed as a single source of truth for outreach performance. When instrumented correctly, this command center gives teams and leaders the data needed to optimise processes, reallocate resources, and forecast booked calls with confidence.
- Invites sent
- Acceptance rate
- Replies
- Campaign performance
- Message-level insights
- Day-by-day engagement
- Conversion patterns
Why This Dashboard Matters
The dashboard translates raw outreach activity into operational metrics so teams can act quickly and leaders can align resources with predictable outcomes.
1. Accountability
Every recruiter sees the direct impact of their invites, messages, and follow-ups making coaching and performance management evidence-based rather than subjective.
2. Predictable Bookings
Owners can forecast likely booked calls over the next 7, 14, and 30 days by combining acceptance, reply, and conversion rates turning outreach activity into a predictable hiring resource planning input.
3. Iteration Velocity
Message-level insights and day-by-day engagement charts let teams scale high-performing sequences quickly and re-engineer weak ones in hours rather than weeks.
4. Risk Reduction
LinkedIn trust-score signals and cadence monitors keep automation behaviours within safe parameters so your reach and profile score aren’t degraded by high-volume or repetitive patterns.
5. Market Intelligence
Segmented metrics show which channels, segments, and messages perform best enabling the team to reallocate effort to the highest-return sources and reduce wasted cost per attempt.
6. Authority Mapping
Message-level A/B results and response-quality scores reveal which authority cues and narrative angles dominate attention in each micro-segment.
This is board-level visibility, not just recruiter-level reporting: it feeds the company’s resource planning, hiring cadence, and go-to-market strategy by turning outreach into measurable business performance data.Data sources & refresh cadence: connect the dashboard to live outreach logs, CRM events, and calendar bookings; refresh daily for operational control and weekly for leadership reviews.
Phil’s Diagnostic Loop – How High-Performers Iterate
High-performing firms don’t “set and forget.” They run a short, repeatable process that turns daily metrics into weekly improvements and predictable appointment flow over time.
Observe
- What to do: Monitor Acceptance Rate, Reply Rate, and Conversion-to-Call Rate daily and by segment. Track message-level responses, day-by-day engagement, and LinkedIn trust-score signals so you have clean source data.
- Owner & KPI: operations lead or team lead Acceptance Rate (daily), Replies (daily), Calls booked (rolling 7/14/30 days).
Diagnose
- What to do: Identify friction points invite language, authority cue, CTA precision, targeting, or response handling. Use positive vs negative response ratio and Conversation Quality Index to prioritise fixes.
- Owner & KPI: senior recruiter or coach Conversation Quality Index, Positive/Negative ratio, LinkedIn Trust Score.
Adapt
- What to do: Run focused experiments (message A/B, CTA variants, timing tests) with clear sample sizes (e.g., 300–500 invites per variant). Implement only one variable per test and measure movement in reply and conversion rates over a two-week window.
- Owner & KPI: campaign owner Reply Rate lift, time-to-first-reply, process adherence.
Scale
- What to do: When metrics exceed predefined thresholds (for example, Acceptance Rate > 20% and Reply Rate > 12% for the segment), increase volume while monitoring trust signals. Scale sequences that show repeatable performance across segments and times.
- Owner & KPI: head of outreach volume, acceptance % and reply % by process, LinkedIn Trust Score.
Systemize
- What to do: Convert winning sequences into team practices and integrate them into your Appointment Booking AI™ workflows or playbooks. Create templates, coaching notes, and a change log so improvements are reproducible across the team.
- Owner & KPI: head of operations/enablement Iteration Loop Efficiency, training completion, repeatability score.
Example iteration (30 days):
- Observe low Reply Rate in fintech
- Diagnose weak authority cue; adapt by inserting a one-line proof point
- Test for 2 weeks (500 accepts)
- Result: Reply Rate +6 percentage points and Conversion-to-Call Rate up 40%.
- Time to implement: ~10 working days. Resources required: 1 senior recruiter, A/B tooling, and dash-boarding access.
This five-step loop is a consulting-grade process that maps metrics to ownership, reduces wasted time and resources, and drives continuous improvement across teams and processes.
Strategic Recommendations (From the Research)
Stabilize Acceptance First (30 days)
If your Acceptance Rate is weak, do not scale volume scaling amplifies noise and increases costs. Focus the next 30 days on three high-impact fixes:
- Owner: Profile & branding lead
Action: Optimise profile headline, summary, and social proof.
Metric to watch: Acceptance % (daily).
Expected improvement: +5–15 percentage points in 2–4 weeks. - Owner: Messaging owner
Action: Run invite A/B tests (two variants, 300+ invites each).
Metric to watch: Acceptance by message.
Example: Swap generic invite for a one-line relevance cue. - Owner: List manager
Action: Tighten segmentation (title, function, company-size).
Metric to watch: Acceptance by segment.
Benefit: Fewer wasted attempts and lower costs per qualified conversation.
Build Multi-Angle Messaging (30–60 days)
Rotate messaging angles to reduce pattern detection risk and increase resonance. Implement as a process with owner, samples, and cadence.
- Speed vs Runway: Emphasise short-term hires or long-term growth depending on segment.
- Proof vs Promise: Test data-driven proof points (metrics, customers) against outcome promises.
- Founder Fluency: Use founder language for C-suite targets; use operational language for hiring managers.
- Owner: Content strategist
- Metric to watch: Acceptance & reply lift per angle.
- Expected outcome: Improved reply diversity and lower detection risk.
Treat Every Reply as a Commercial Opportunity (Immediate)
Treat inbound replies as conversion moments. The smallest improvements in reply handling can markedly raise Conversion-to-Call Rate.
- Owner: Reply handler or SDR
- Action: Use templated, personalised responses with a clear CTA.
- Metric: Time-to-first-reply and conversion-to-call %.
Example: Insert a one-line credibility cue + two available times or a calendar link. Test for lift over 200 replies.
Monitor LinkedIn Trust Signals (Ongoing)
Erratic activity leads to algorithmic penalties that increase outreach costs and reduce effectiveness. Track trust signals as an operational score.
- Owner: Operations lead
- Action: Enforce cadence limits, vary messaging, monitor account health metrics.
- Metric: LinkedIn Trust Score Signals and reach per invite.
Systemize ALL Messaging (60–90 days)
Standardise successful sequences into firm playbooks and integrate them into your team tools so every recruiter speaks with one voice.
- Owner: Enablement lead
- Action: Create templates, playbooks, training sessions.
- Metric: Adoption rate and message effectiveness across employees.
Use Dashboards as Coaching Tools (Immediate & Ongoing)
Dashboards reveal coaching gaps faster than one-on-one feedback. Use them to prioritise training and measure improvement.
- Owner: Head of talent operations
- Action: Run weekly coaching based on conversation quality and process adherence.
- Metric: Improvement in reply and conversion rates per coached recruiter.
Align Activities with Revenue (30–90 days)
- Owner: Commercial lead
- Action: Tie KPIs to revenue forecasts and reduce expenses on low-performing channels.
- Metric: Cost per qualified call and projected pipeline value.
Adoption readiness checklist (quick):
- Executive sponsor, access to outreach data, a 30–60 day test budget, and an owner for each recommendation.
- Resources required vary by initiative but are typically limited to 1–2 people and modest tooling for A/B testing and dashboarding.
These strategies prioritize process, measurable improvement, and resource efficiency turning outreach into a predictable driver of hiring success and organisational performance.
Phil’s Commentary
Your metrics are a mirror. They show whether your market sees you as noise or as a partner. Low numbers aren’t a setback they’re intelligence. Fix the system, adjust the behaviour, rewrite the message. When the numbers move, so does your revenue.
Conclusion – Metrics are the new competitive advantage
Recruitment firms that master these three KPIs acceptance, replies, conversion gain clarity, predictability, and authority. Measured consistently, these metrics are often correlated with improved pipeline quality, lower hiring costs, and faster time-to-hire.
- They reduce randomness.
- They increase stability.
- They enable precise scaling.
- They let you dominate a chosen segment.
Applied thoughtfully, Appointment Booking AI™ can accelerate this work by operationalising successful message templates and playbooks at scale shortening the team’s learning curve and amplifying improvements in performance that would otherwise take months of manual iteration.
What boards and leaders should do next:
- Run a 30‑day Acceptance Audit: measure invites, accepts, and per-segment acceptance % to identify immediate fixes.
- Commit to two micro-experiments in the next 14 days (message A/B and CTA variant) and track reply and conversion lift.
- Establish weekly dashboard reviews (Acceptance, Reply, Conversion) to align resources and coaching with measurable goals.
When a company treats outreach as a measurable process and aligns team incentives to the right metrics, hiring becomes predictable and more cost-effective improving recruiter experience, reducing turnover risk, and accelerating business outcomes.
When measured consistently, recruitment outreach metrics give firms clarity, predictability, and a competitive advantage across every hire.
Explore our LinkedIn Invite Checklist to improve acceptance instantly.
Learn how Appointment Booking AI™ builds predictable pipelines.
Book Your Strategy Call
For North American Recruiters (US & Canada)
For MENA & Australia Recruiters
What you’ll get on the call: a short KPI analysis of your current outreach, three prioritized levers you can test in the next 30 days, and a customised 30‑day appointment system blueprint designed to reduce cost per outreach and improve cost per hire.
Before the call, please bring your last 30 days of outreach data (invites sent, accepts, replies, and booked calls) so we can deliver an actionable plan in one session. Calls are time-boxed to respect your schedule and focused on processes and resources you can implement immediately.
